Clinical study overview
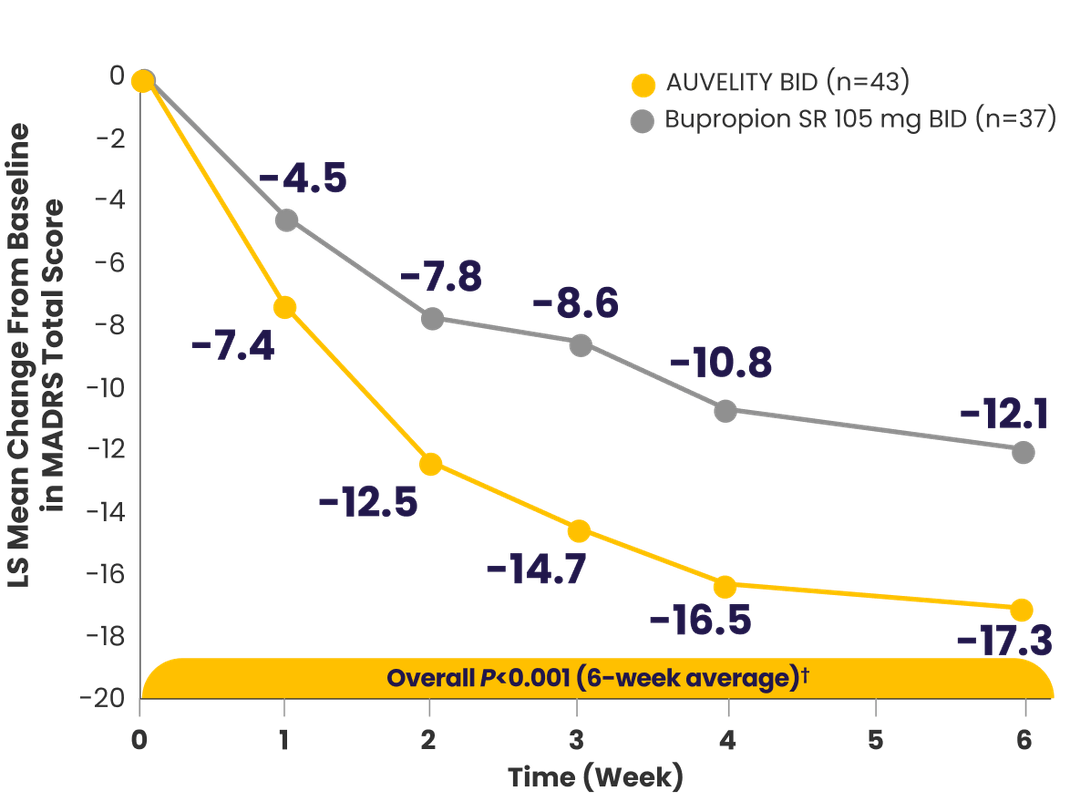
The GEMINI pivotal study was a Phase 3, double-blind, placebo-controlled study that evaluated AUVELITY vs placebo for 6 weeks in 327 patients (n=163 AUVELITY and n=164 placebo) with MDD. The study met its primary endpoint of symptom improvement on the MADRS total score at Week 6. Key secondary endpoints were change in MADRS total score from baseline to Week 1 and Week 2, response (≥50% improvement in MADRS total score) at Week 6, and remission (MADRS total score ≤10) at Week 2.1 See full study design.
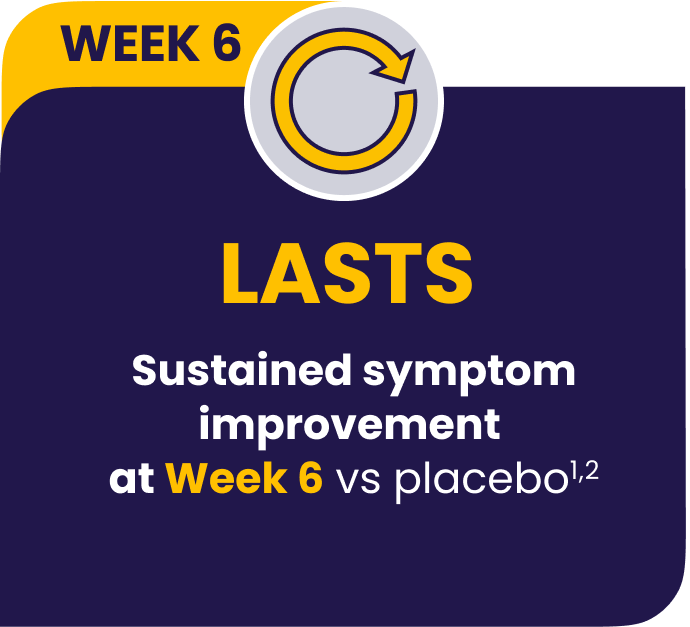
AUVELITY provided MDD symptom improvement that was FAST & LASTS1,2
Symptom improvement in MADRS total score vs placebo1-3*†‡
P-values for Weeks 3 and 4 were not adjusted for multiplicity and are therefore not presented.1
*mITT population (all randomized patients who took at least 1 dose of study drug and had at least 1 post-baseline assessment).3
†Missing data were not imputed.1
‡Minimal clinically important difference estimates for MADRS ranged from 1.6 to 1.9 between treatment groups. The MCID is a concept defined as ”the smallest difference in a score that patients perceive as beneficial.”4,5
§Endpoints analyzed using MMRM.3
BID=twice a day; LS=least squares; MADRS=Montgomery‑Åsberg Depression Rating Scale; MDD=major depressive disorder; mITT=modified intention‑to‑treat; MMRM=mixed model with repeated measures; PHQ-9=Patient Health Questionnaire-9.
Substantial MDD symptom improvement
with AUVELITY1
Protocol-defined remission1*†MADRS total score ≤10
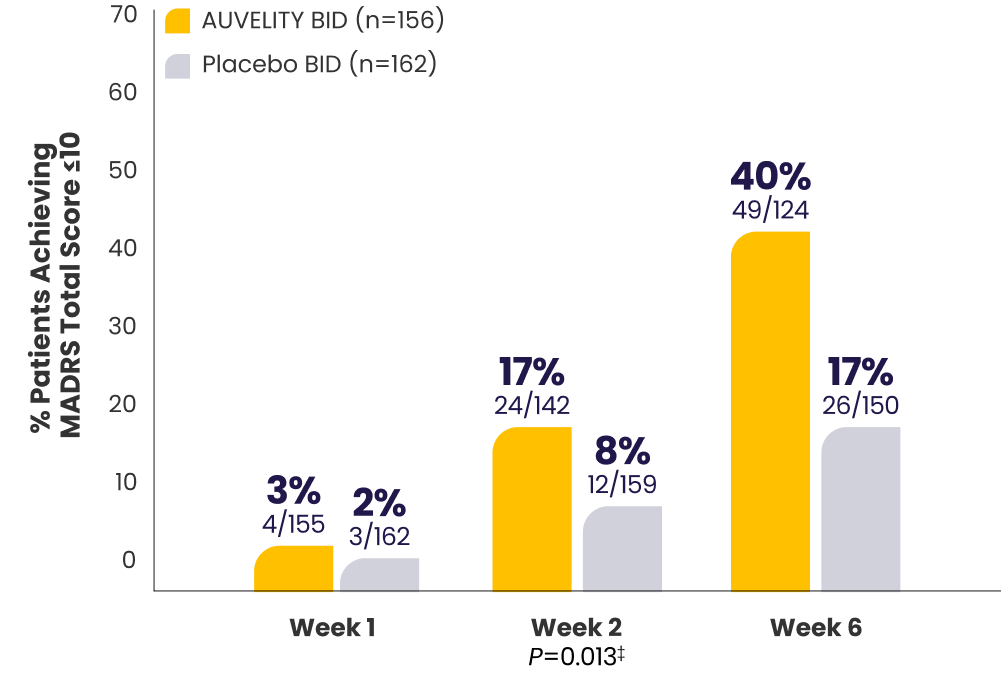
P-value for Week 6 was not adjusted for multiplicity and is therefore not presented.
Protocol-defined response1*†≥50% improvement in MADRS
total score from baseline
total score from baseline
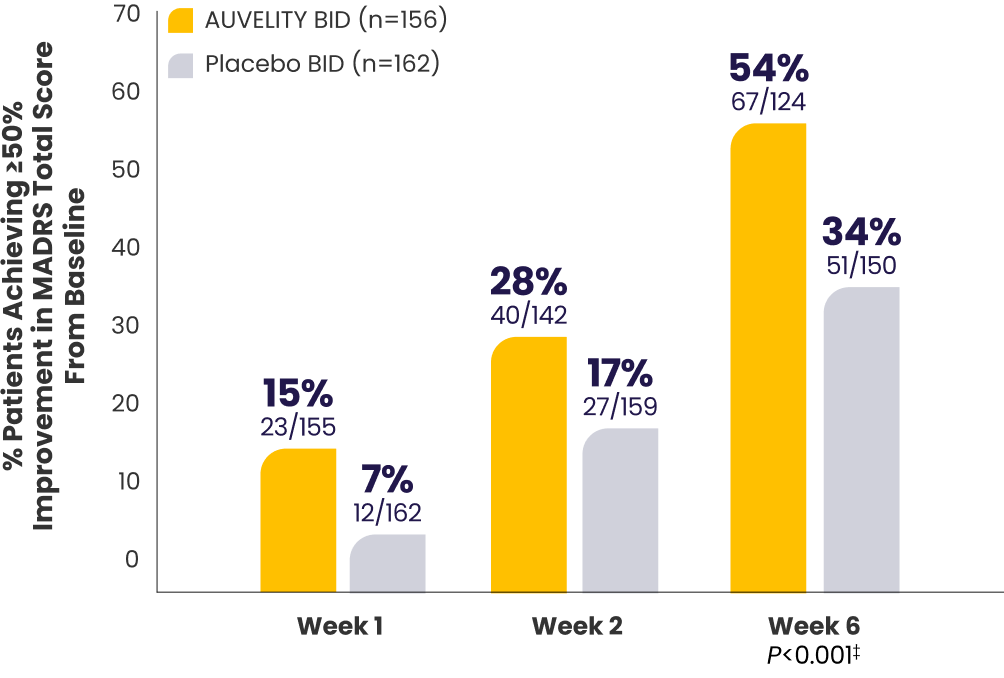
P-values for Weeks 1 and 2 were not adjusted for multiplicity and are therefore not presented.
*mITT population (all randomized patients who took at least 1 dose of study drug and had at least 1 post-baseline assessment).1
†Missing data were considered failures.1
‡Endpoints analyzed using a chi-squared test.1
BID=twice a day; MADRS=Montgomery‑Åsberg Depression Rating Scale; MDD=major depressive disorder; mITT=modified intention‑to‑treat; PHQ-9=Patient Health Questionnaire-9.
The AUVELITY Patient Experience
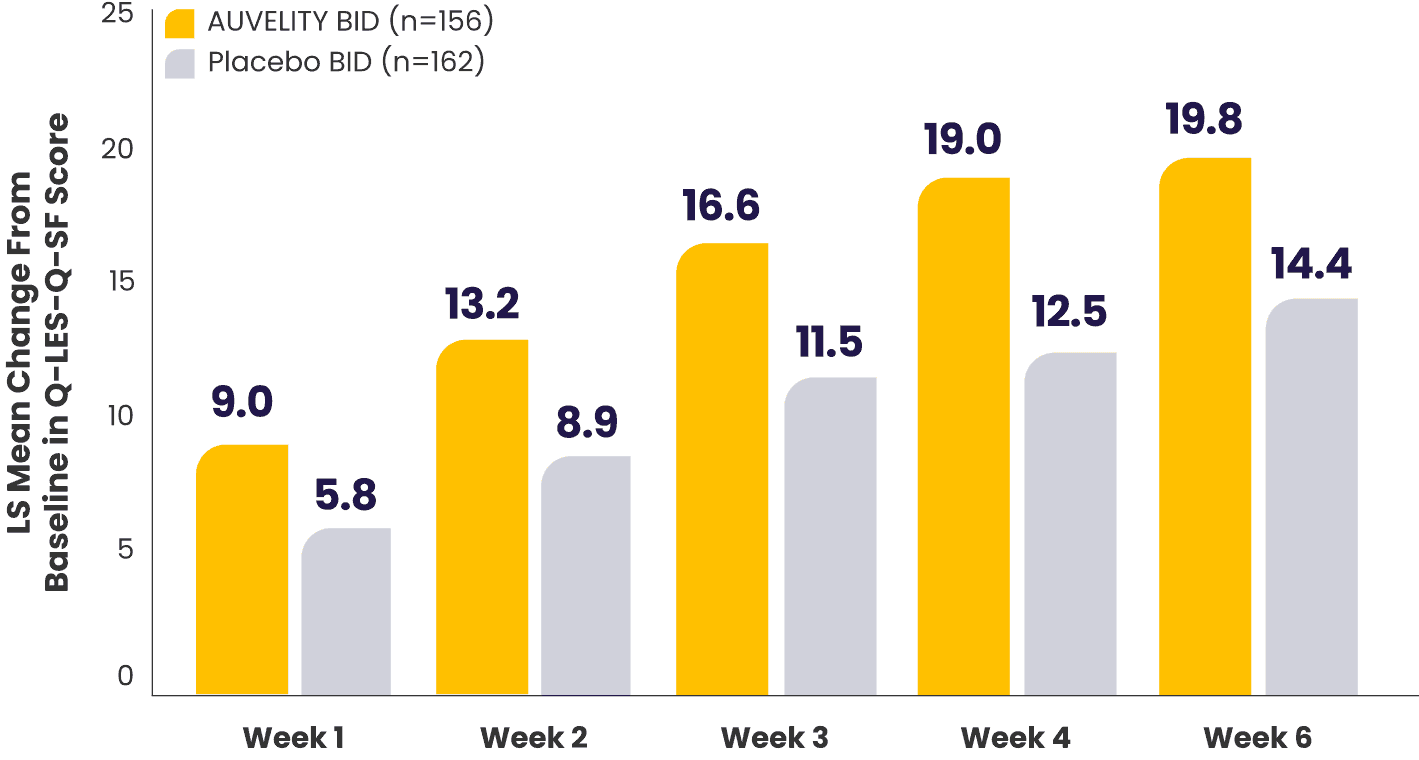
Improvement in quality of life and enjoyment scores from Week 1 to Week 67
Quality of life and enjoyment scores (Q‑LES‑Q‑SF) vs placebo7*†
What does the Q-LES-Q-SF scale measure?8
*mITT population (all randomized patients who took at least 1 dose of study drug and had at least 1 post-baseline assessment).1,7
†Missing data were not imputed.1
BID=twice a day; LS=least squares; mITT=modified intention‑to‑treat; Q-LES-Q-SF=Quality of Life Enjoyment and Satisfaction Questionnaire-Short Form.
Improvement in function scores from Week 1 to Week 67
Sheehan Disability Scale (SDS) scores vs placebo7*†
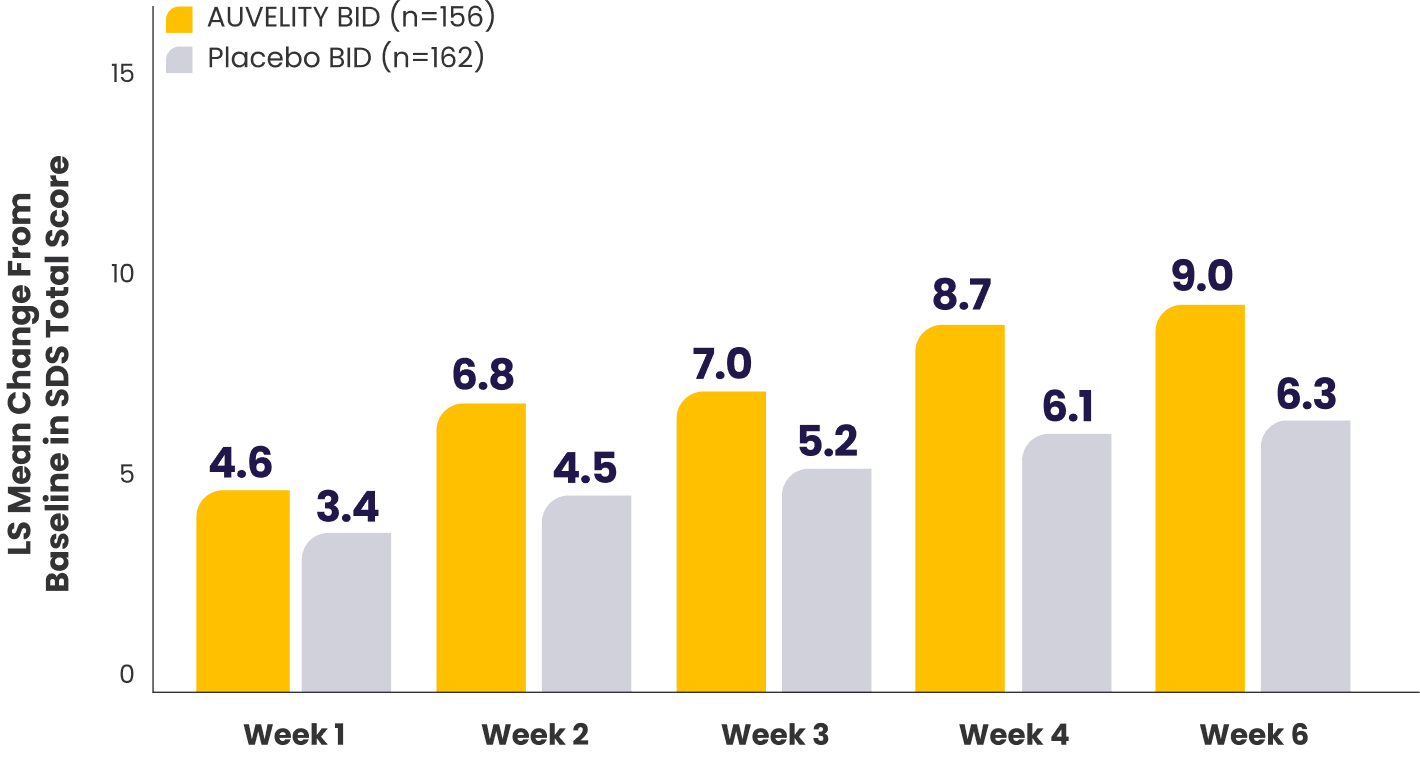
P-values for comparisons were not adjusted for multiplicity and are therefore not presented.
What does the SDS scale measure?10
*mITT population (all randomized patients who took at least 1 dose of study drug and had at least 1 post-baseline assessment).1,7
†Missing data were not imputed.1
‡Work includes paid work, unpaid volunteer, or training.10
BID=twice a day; LS=least squares; mITT=modified intention-to-treat.
GEMINI Phase 3 Study Design1

- LS mean change in MADRS total score from baseline at Week 1
- LS mean change in MADRS total score from baseline at Week 2
- Percentage of patients achieving response (≥50% reduction in MADRS total score from baseline) at Week 6
- Percentage of patients achieving remission (MADRS total score ≤10) at Week 2
- Clinical Global Impression-Improvement (CGI-I)
- Clinical Global Impression-Severity (CGI-S)
- Quality of Life Enjoyment and Satisfaction Questionnaire-Short Form (Q-LES-Q-SF)
- Sheehan Disability Scale (SDS)
- Patient Global Impression of Improvement (PGI-I)
- Quick Inventory of Depressive Symptomatology-Self-Report (16 items) (QIDS-SR-16)
Efficacy assessments
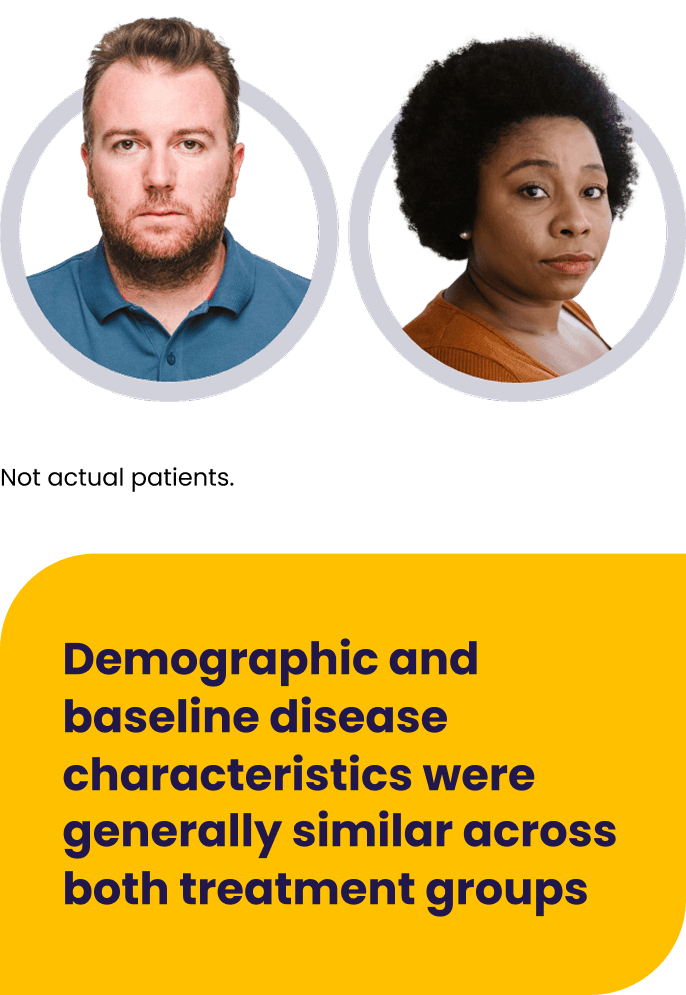
Patients with moderate to severe MDD were evaluated in the GEMINI trial1

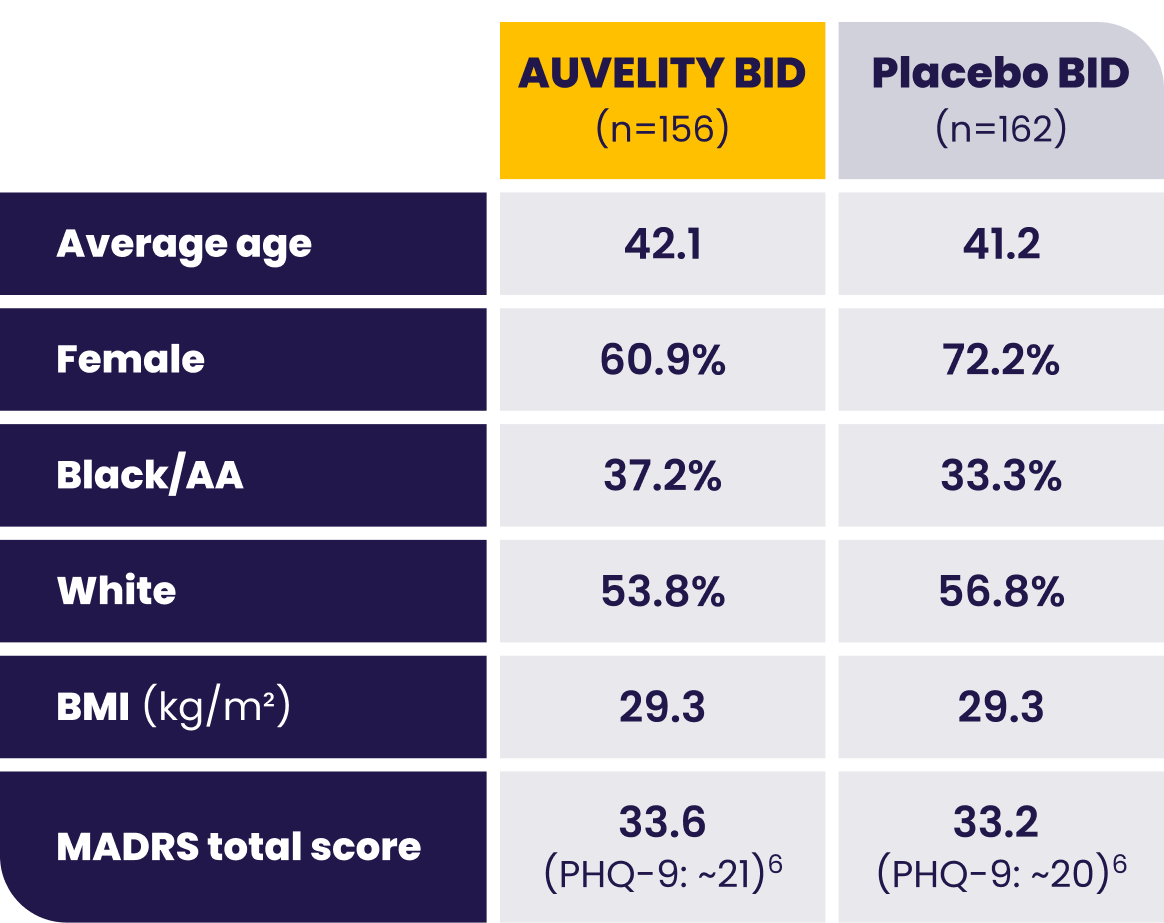
AA=African American; BID=twice a day; BMI=body mass index; LS=least squares; MADRS=Montgomery-Åsberg Depression Rating Scale; MDD=major depressive disorder; mITT=modified intention-to-treat; PHQ-9=Patient Health Questionnaire-9.
